Team Overview
Last updated: April 22, 2026
“Team Overview” Overview
The Team Overview pages are provided to Administrative Users and Managers to get information on how their teams are performing. These pages will not be visible or accessible by users without manager or admin permission.
Within Team Overview pages, there is a dropdown menu at the top right corner of the screen to filter out specific courses. After selecting a course from this menu, only the simulations, quizzes or other relevant information related to this course will be displayed. By default, the All Courses option is selected, to display a more comprehensive breakdown of your team’s progress.
Team Overview is broken down into four sections:
On-Demand Courses
All Quizzes
Assigned Courses Overview
The Team Overview > Assigned Courses page provides a table with all records of sessions completed by trainees within your team.
Sessions are the iterations (attempts) at interactive simulations. Trainees are encouraged to repeat simulations, adjusting their approach based on the feedback they are provided. This results in multiple sessions per simulation. If a course has one simulation task, and a trainee tries that same simulation three times, it should appear as three unique sessions associated with one course.
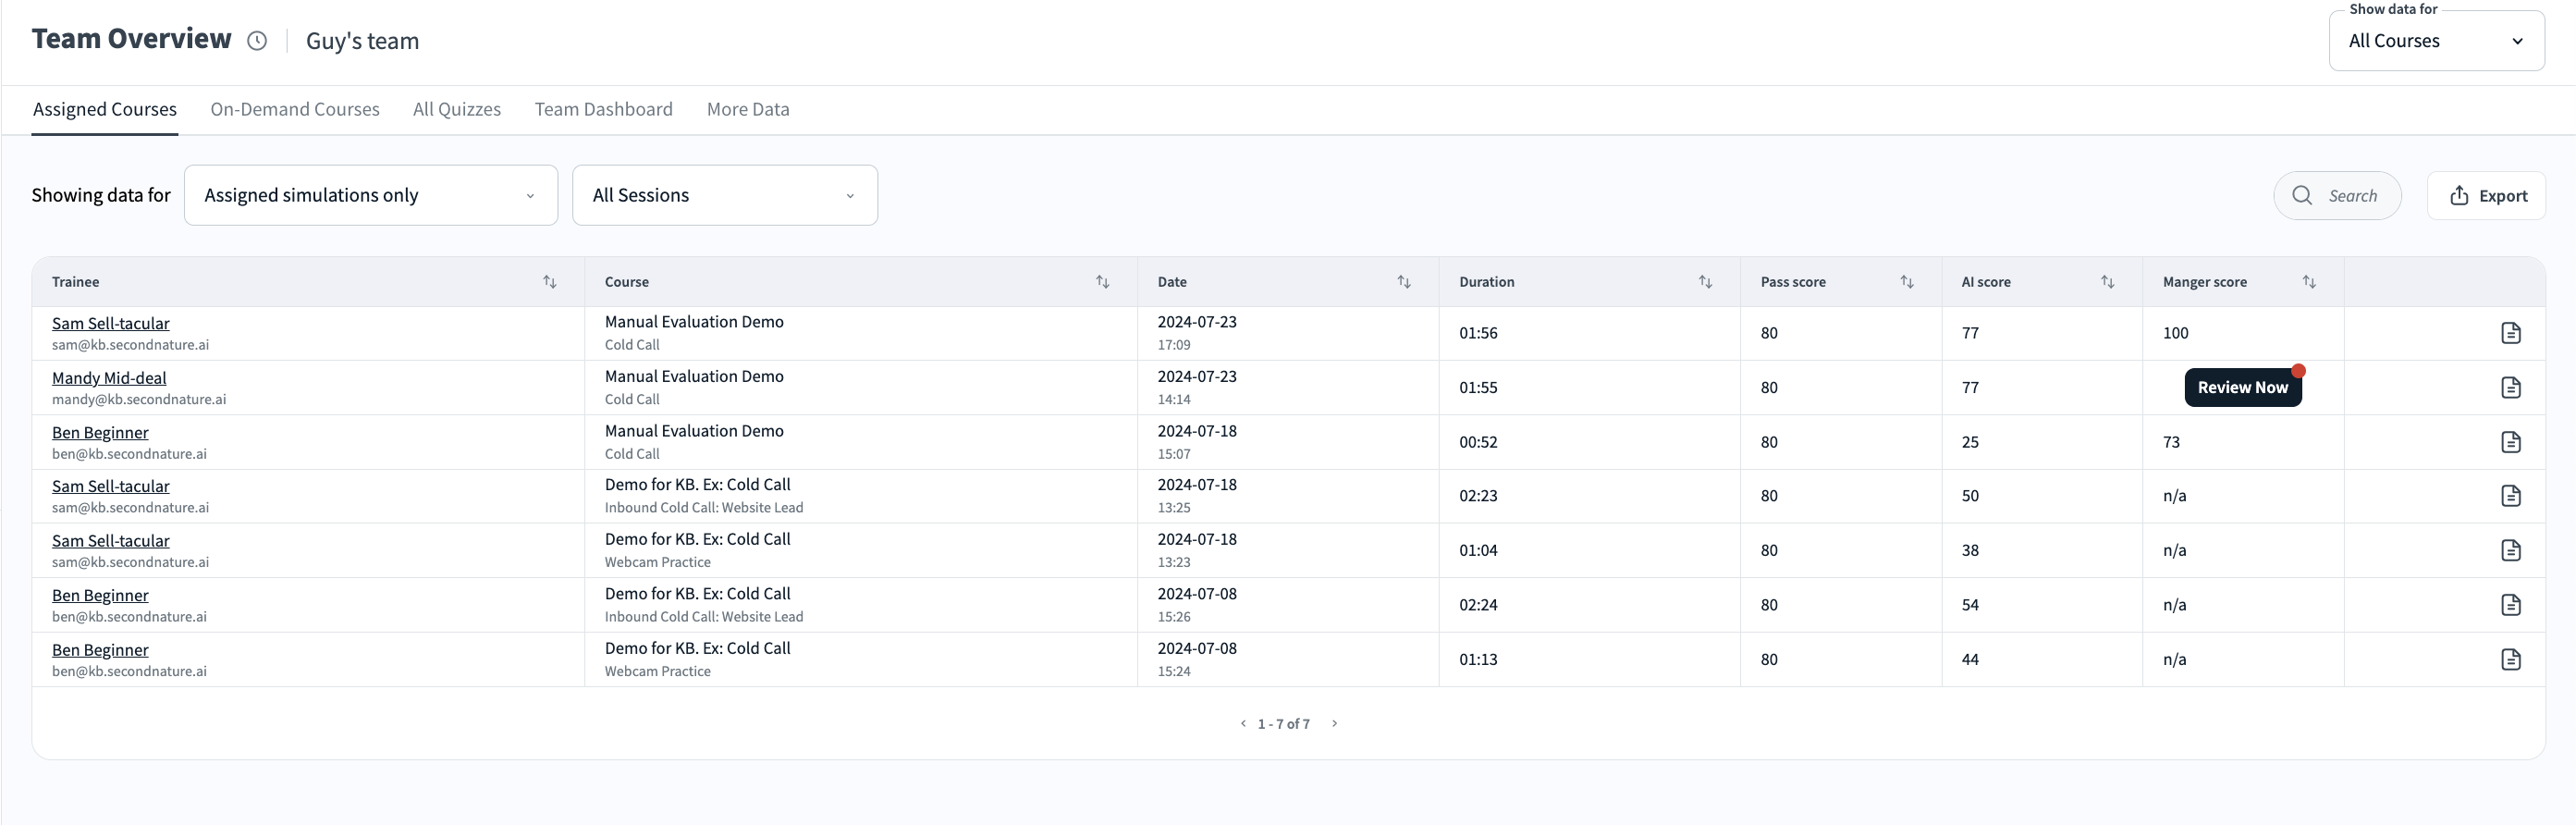
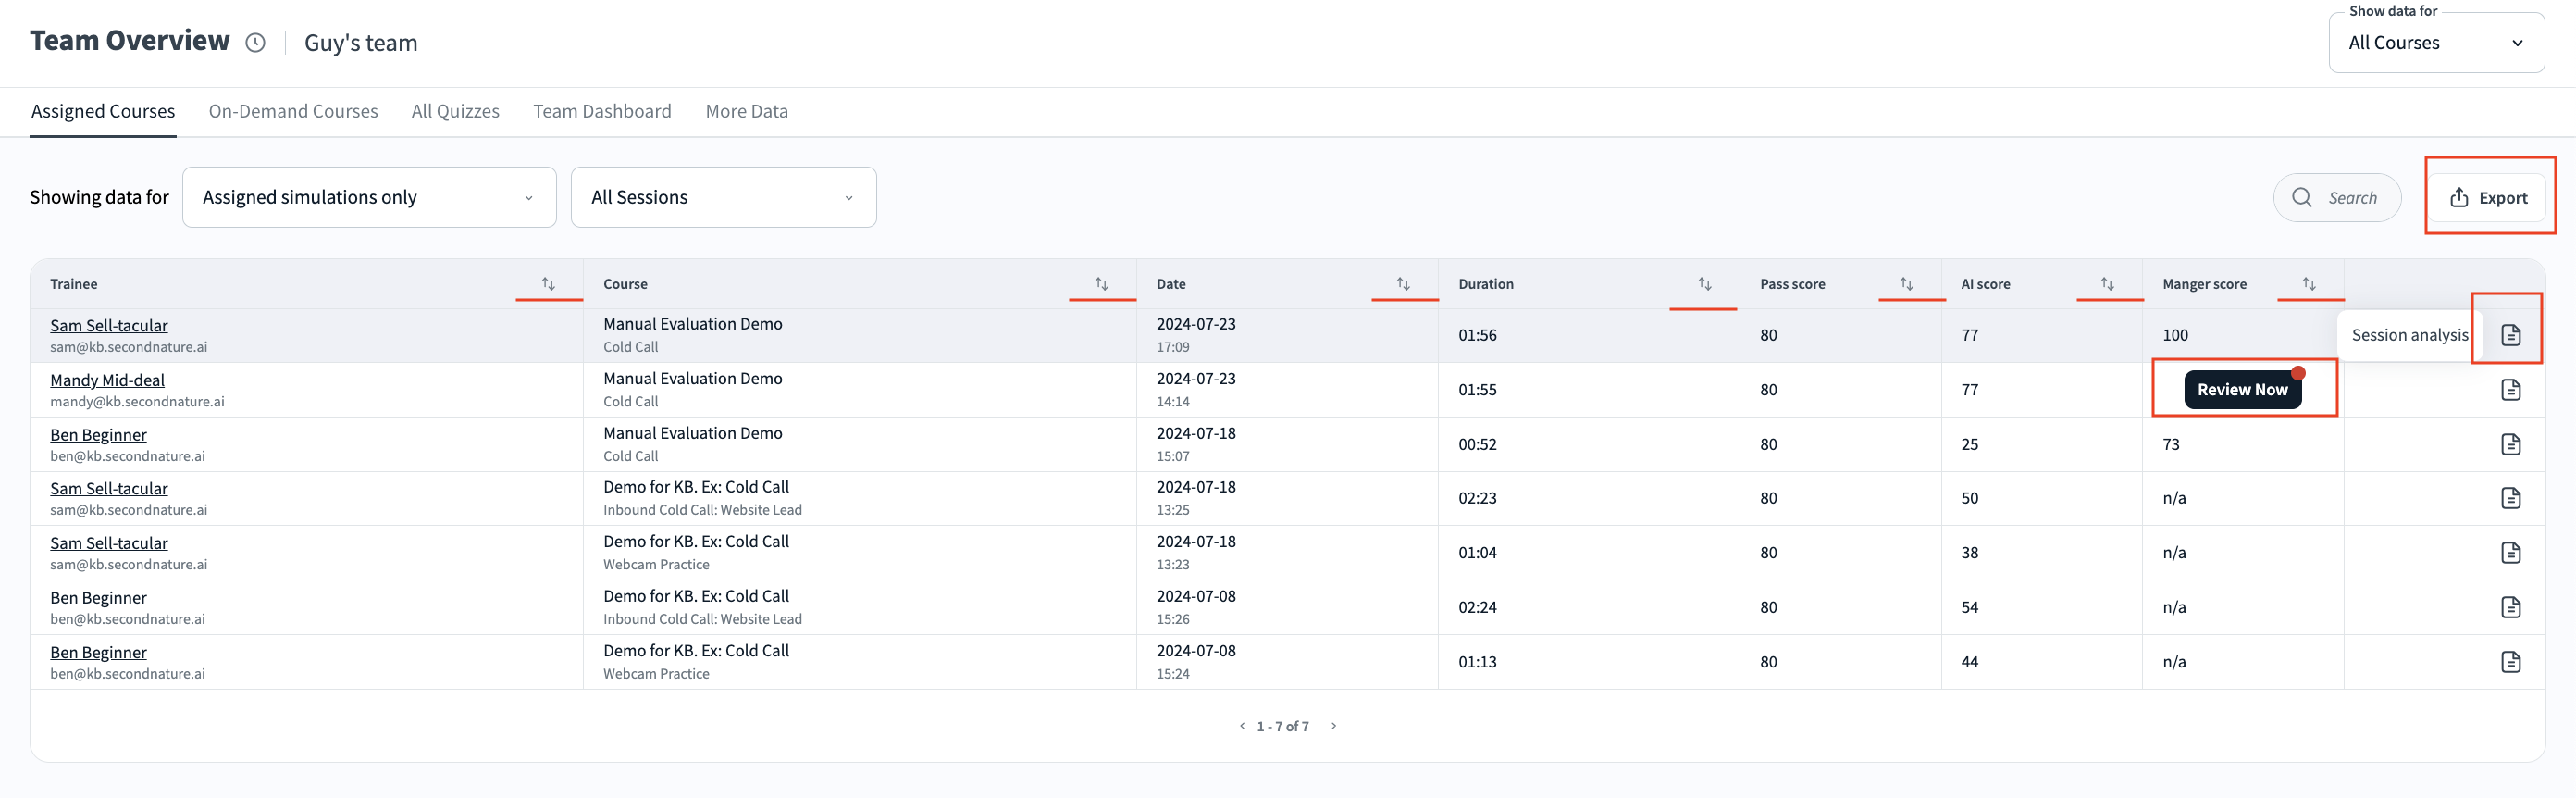
Example of “Assigned Courses” page:
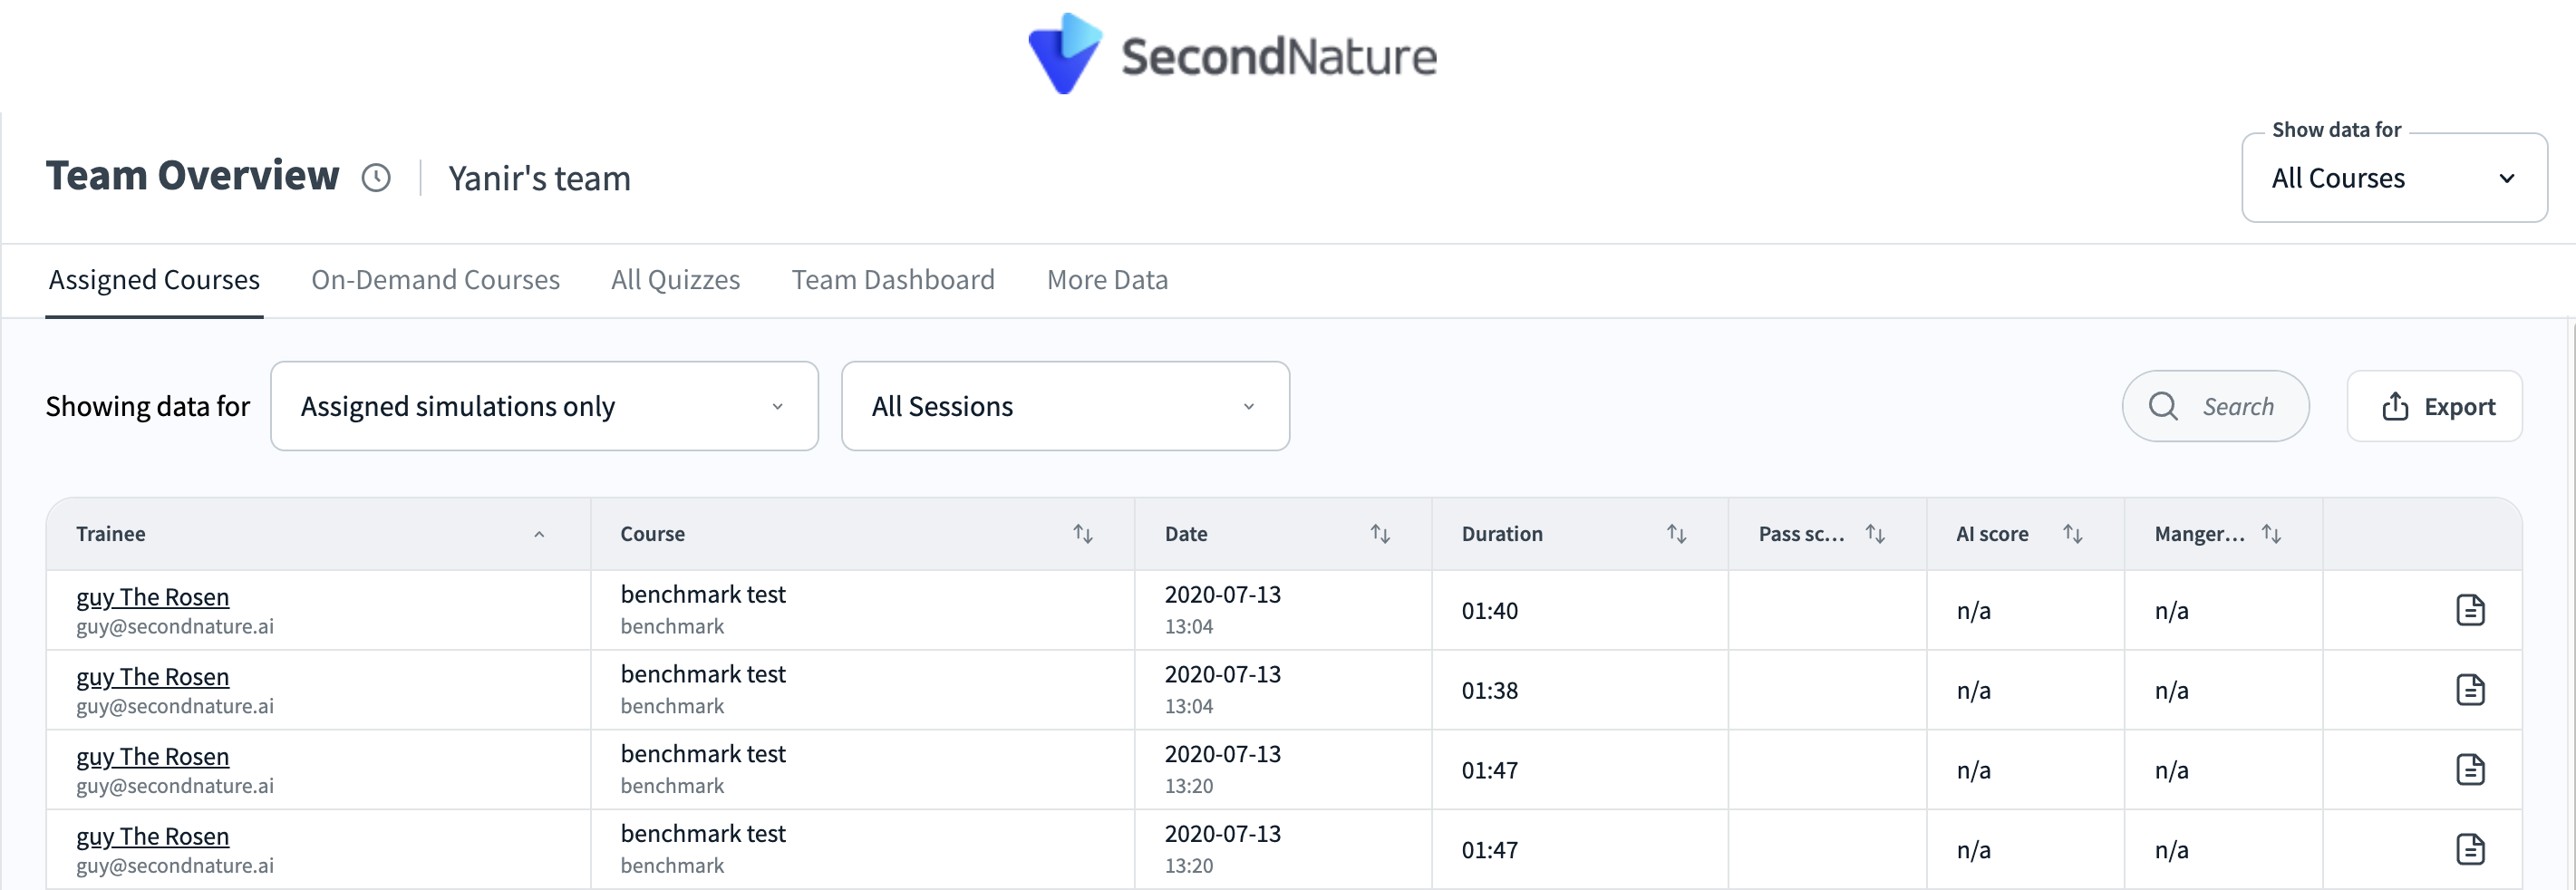
Within the Team Overview > Assigned Courses section, there is information on your team's session performance of only the courses that they were assigned to.
This info can be filtered according to 2 filters :
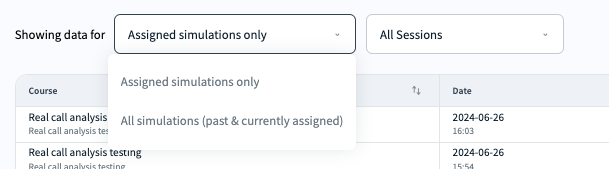
Assignment type - Filter the table data to show sessions based on the course assignment status:
'Assigned simulations only' - The table will show only simulations that the trainee is currently assigned to
'All simulations [past & currently assigned]' - The table will show simulations that the trainee is currently assigned and past simulations in which the trainee was assigned, started practicing, and then was un-assigned for some reason.
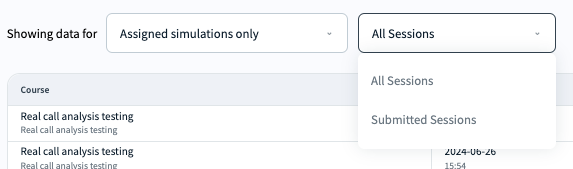
Submission type - Filter the table data to show simulations based on all sessions [AI-evaluated sessions and manual-evaluated sessions] or only the ones that were submitted for manual evaluation.
All Sessions - Shows all sessions that the trainee has done [regardless of the evaluation method]. If a session is eligible for manual grading, you will see a Submit (session) button in the “Manger Score” column of the relevant session, which you may press to notify the evaluator that a session is ready to be graded.
Submitted Sessions - filters out only the simulations that were submitted for manual evaluation by a course evaluator.
On the right-hand side of any record in My Sessions is a Sessions Analysis button
Within the Assigned Courses tab, you may also click the vertical ellipsis on the right-hand side of a record to reveal a dropdown menu. Press Delete to permanently delete a session.
Team Overview > Assigned Courses > All Sessions
There are five actions available on this page:
a. If a session was submitted by a trainee for evaluation, a Review Now button will be visible. Press this button to launch the Analysis page, watch the trainee perform a simulation task, and then provide a grade based on how well they covered the topics selected for the simulation.
b. Press the Export button to generate an Excel (.xlsx) file containing details on all of your team’s completed sessions. A popup will inform when the file is ready. Within this popup, press here in “Click here to download” to download the file.
c. Press the arrow(s) button to the right of a column’s header to sort the table. For example, click the arrows by Course to sort the table alphabetically by course name. Press a sort button a second time to reverse the sorting.
d. Press the Session analysis button on the right hand side of a record to launch an analysis of the relevant quiz in a new tab. This will show the quiz questions, trainee’s answers and correct answers.
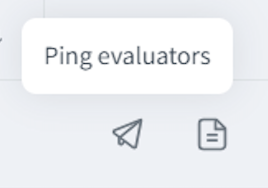
e. There may be an additional Ping Evaluators option if the session was submitted. Continue reading to learn more about this option.
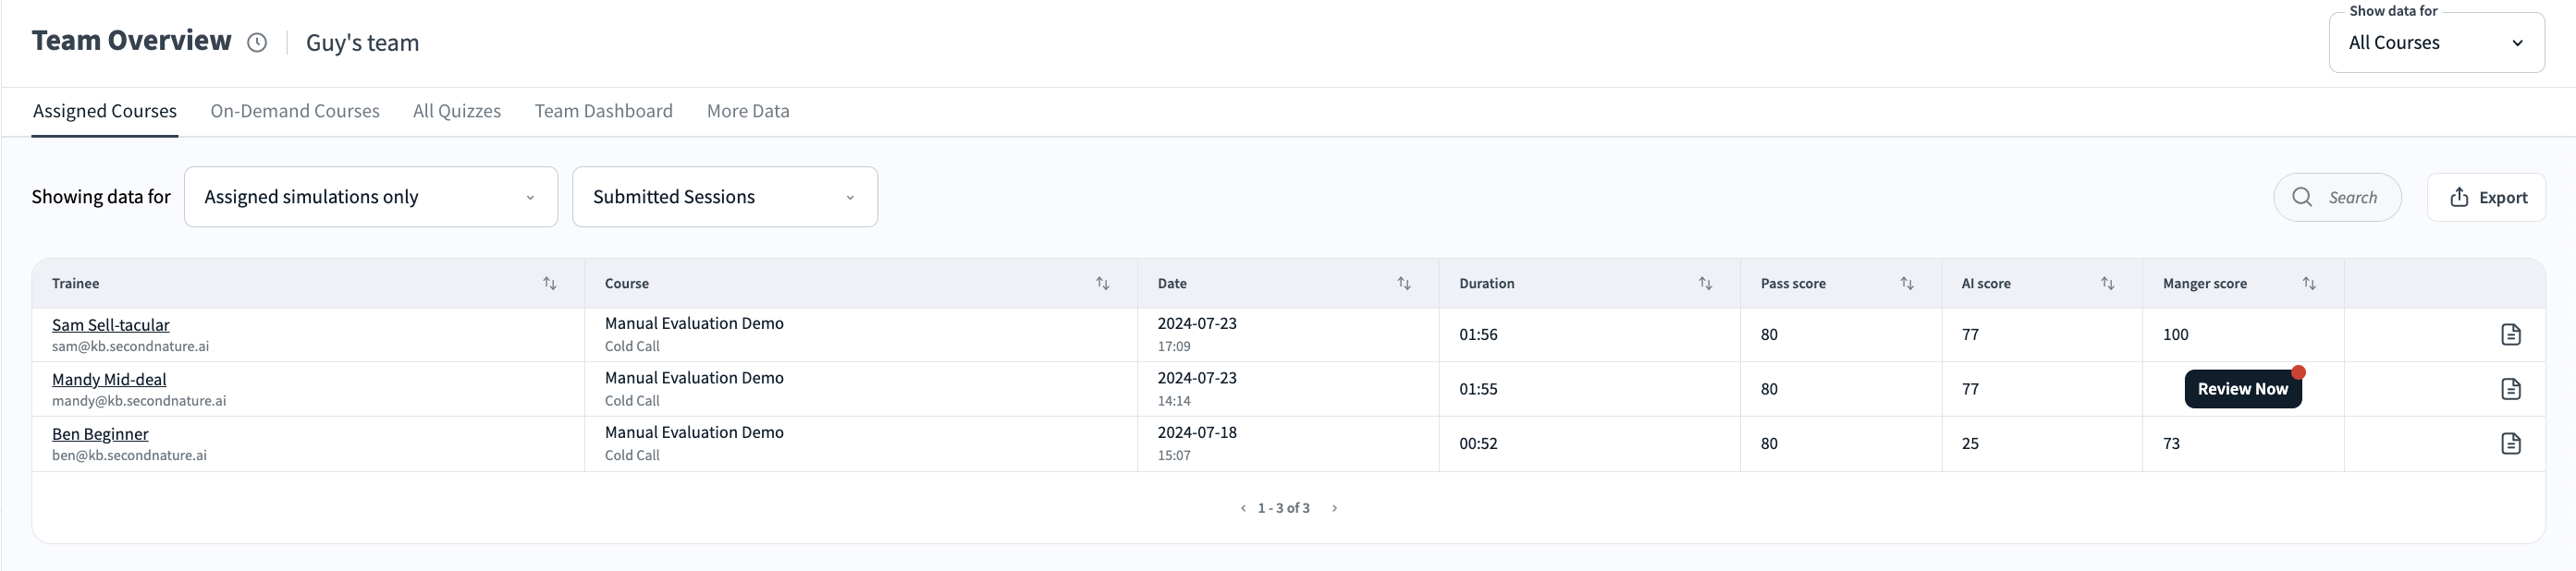
Team Overview > Assigned Courses > Submitted Sessions
In the Submitted Sessions section you can filter the team’s sessions that were submitted for evaluation.
On-Demand Courses Overview
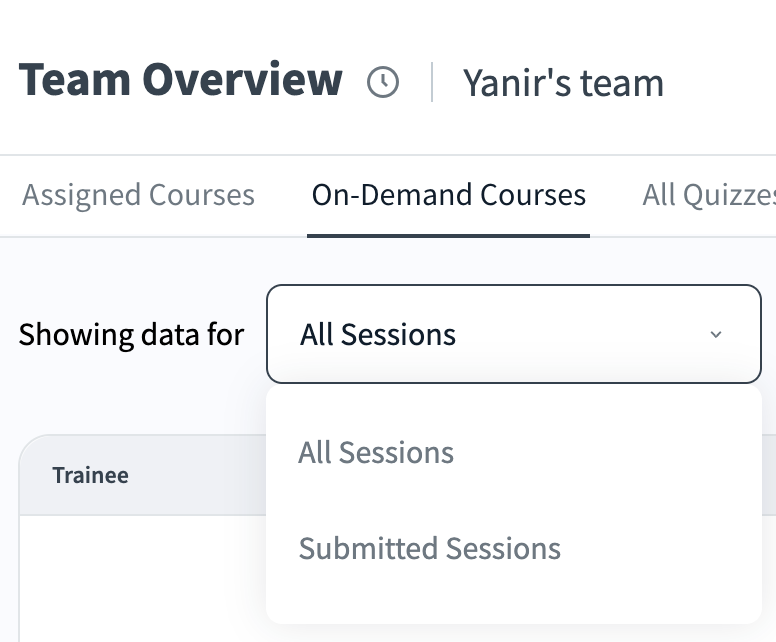
Within the Team Overview> On-Demand Courses section, there is the performance data for your sessions from courses categorized as "On-Demand.".
This info can be filtered according to
Submission type - Filter the table data to show simulations based on all sessions [AI-evaluated sessions and manually evaluated sessions] or only the ones that were submitted for manual evaluation.
All Sessions - Shows all sessions that the trainee has done [regardless of the evaluation method]. If a session is eligible for manual grading, you will see a Submit (session) button in the “Manger Score” column of the relevant session, which you may press to notify the evaluator that a session is ready to be graded.
Submitted Sessions - filters out only the simulations that were submitted for manual evaluation by a course evaluator.
All Quizzes
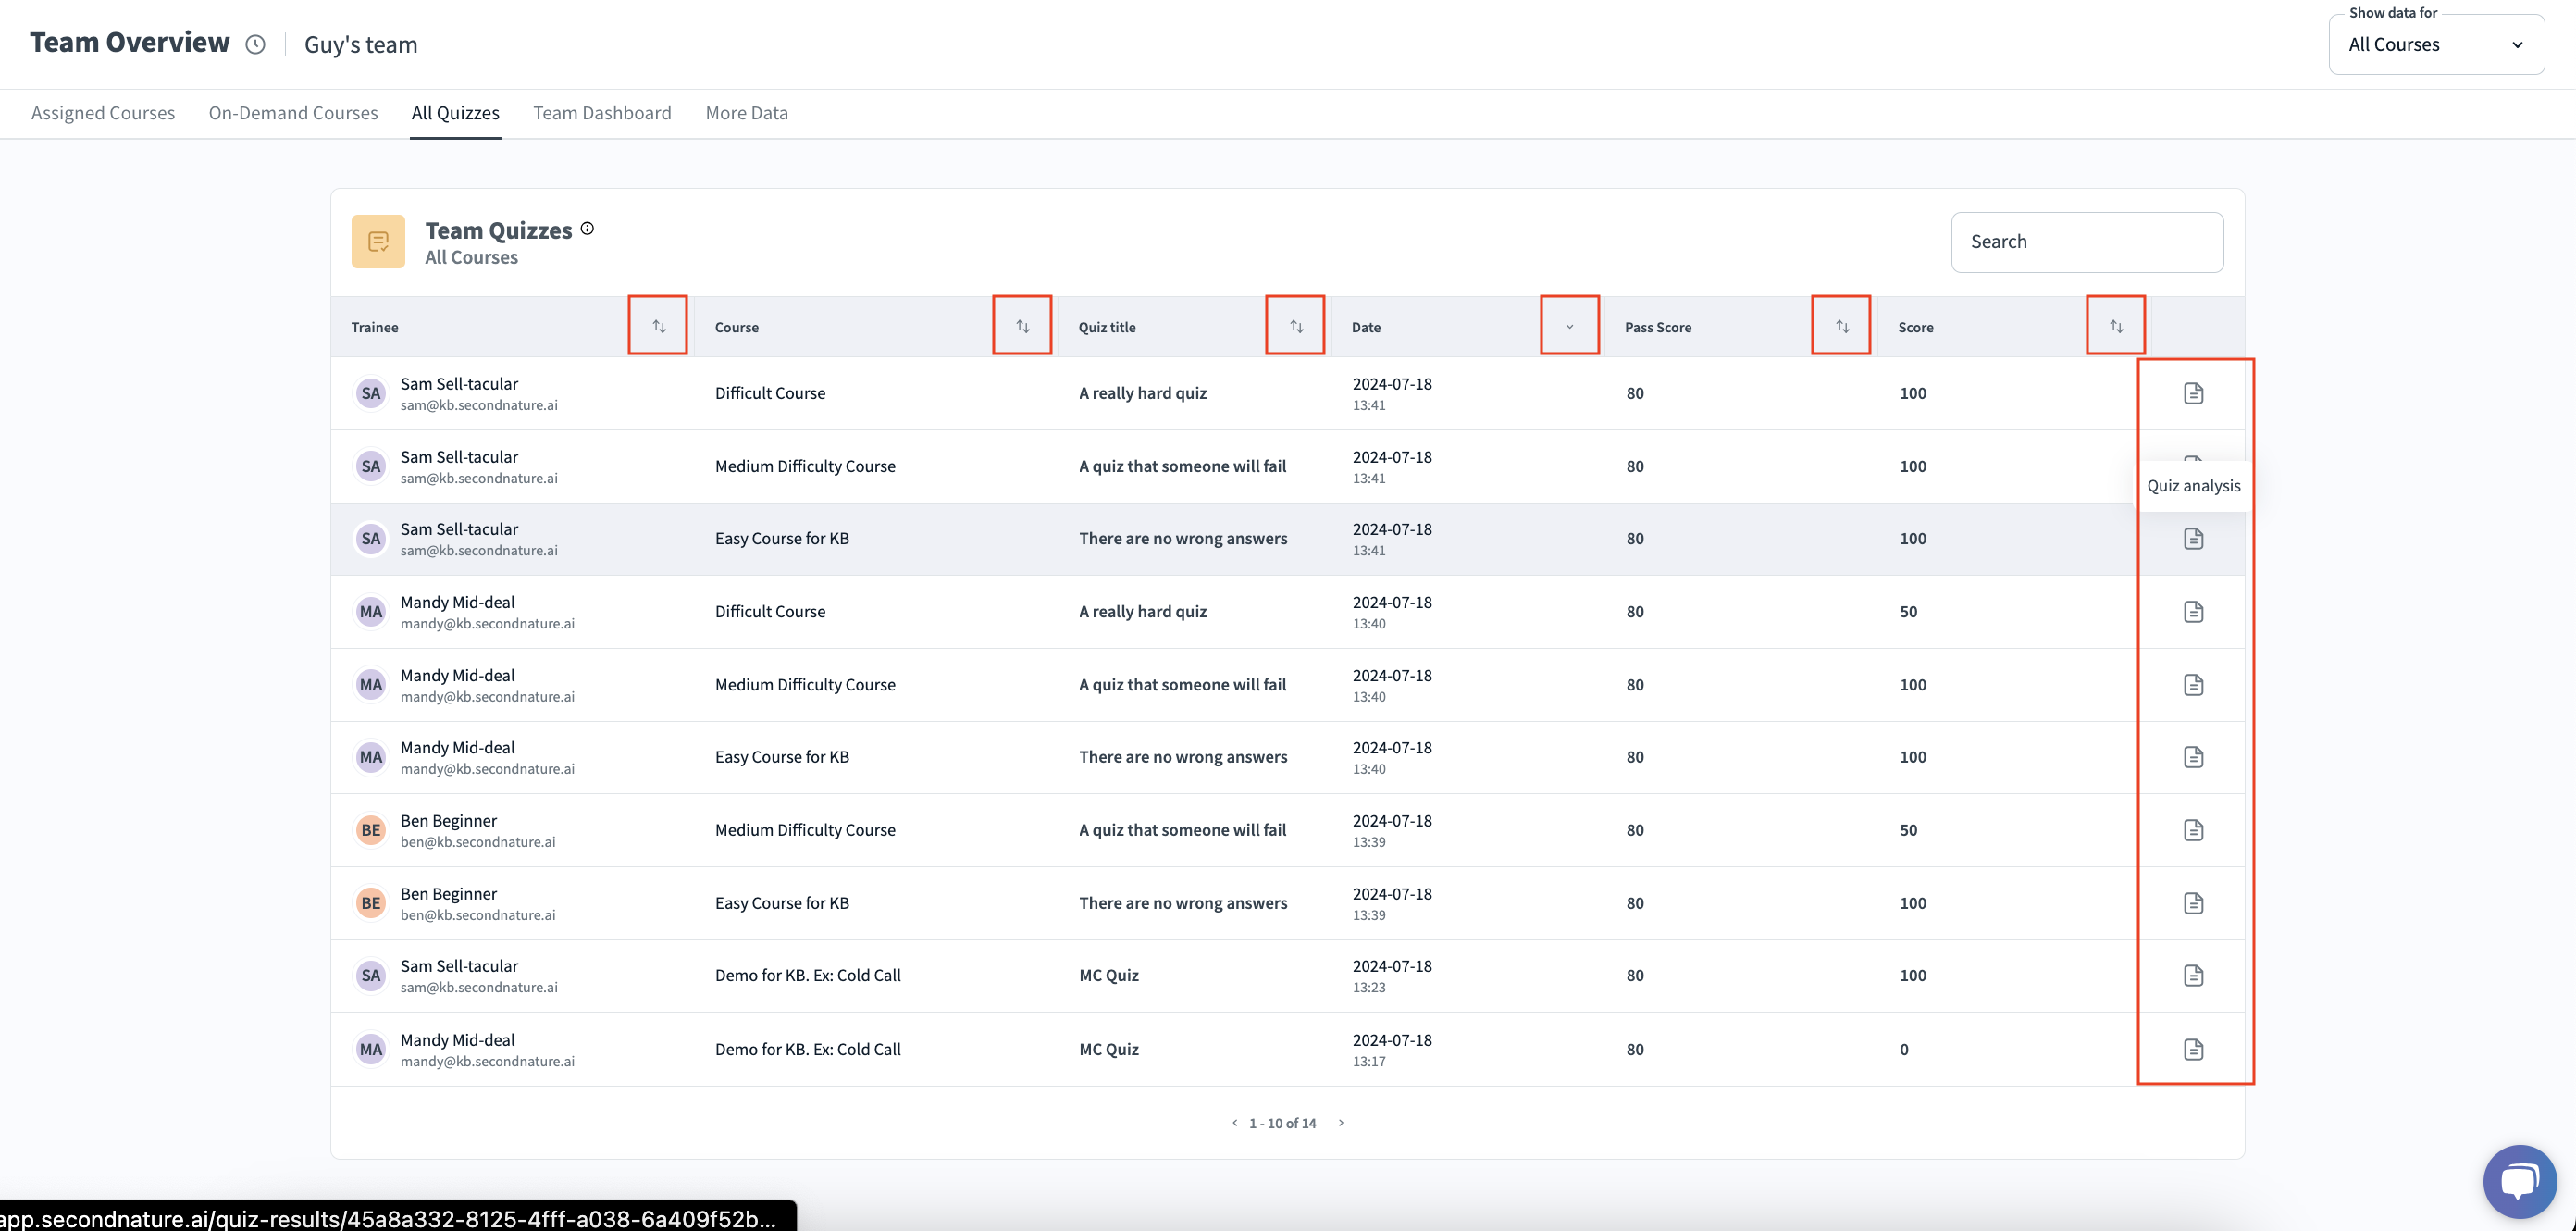
The Team Overview > All Quizzes page provides a table with all records of quizzes completed by trainees within your team. There are two actions available on this page.
a. Press the arrow(s) button to the right of a column’s header to sort the table. For example, click the arrows by Quiz title to sort the table alphabetically by the quiz title. Press a sort button a second time to reverse the sorting.
b. Press the Quiz analysis button on the right hand side of a record to launch an analysis of the relevant quiz in a new tab. This will show the quiz questions, trainee’s answers and correct answers.
Team Dashboard
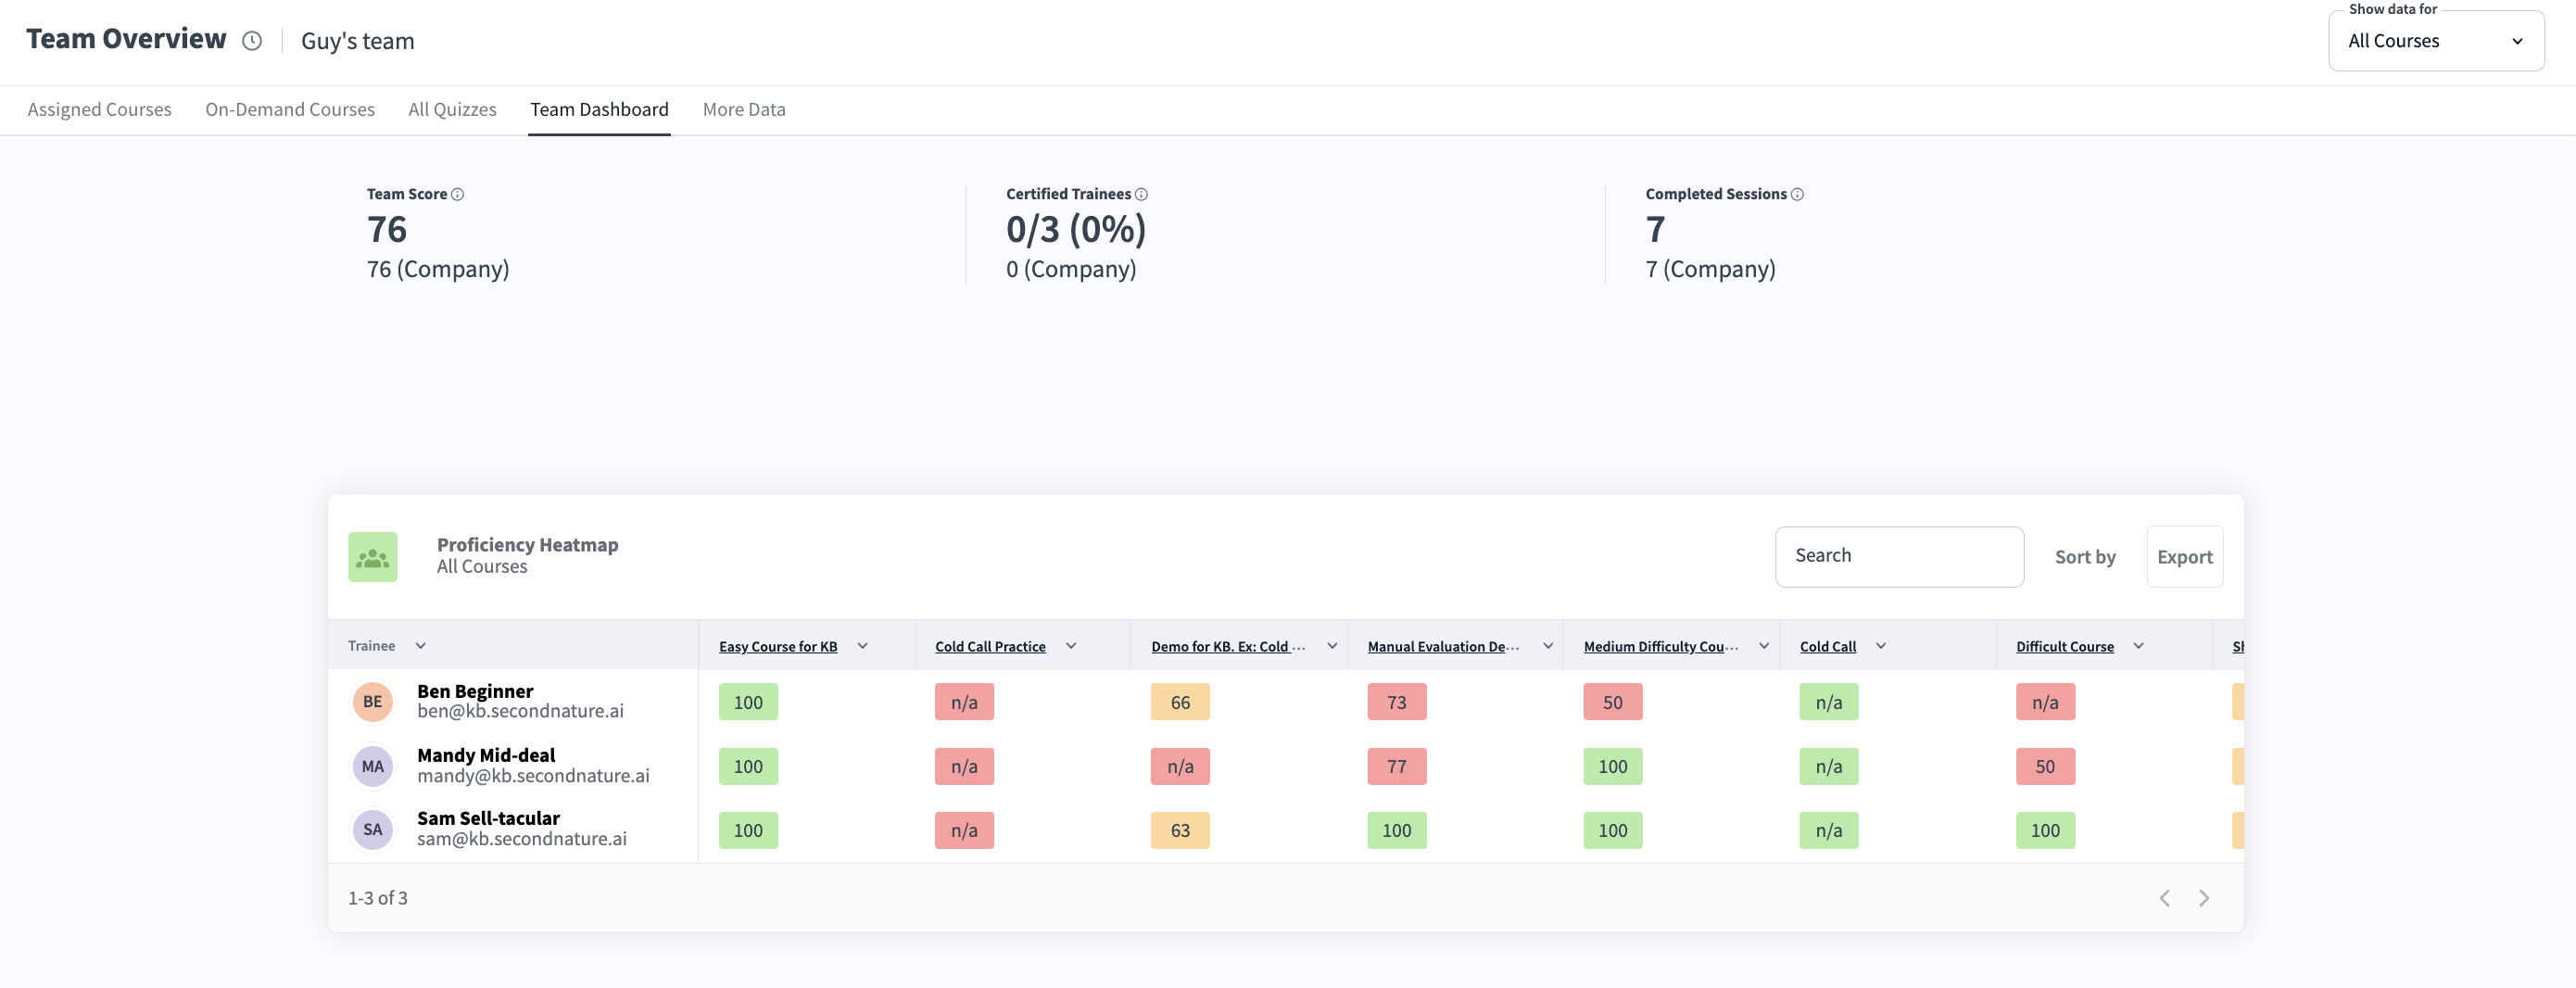
The Team Overview > Team Dashboard page provides an overview of your team’s overall performance. At the top of the page are three figures representing the Team Score (the average of all courses completed by all trainees, excluding those that were not completed), number of Certified Trainees (trainees are certified when they have passed all courses they are assigned), and raw number of Completed Sessions.
Within this page, there is a table displaying a heatmap of each trainee’s performance. The heat map uses colors to represent progress. See "Heatmap Explanation" for more information.
Above the table:
a. Use the search bar to filter based on a user’s first name, last name or email.
b. Press Sort by to reveal additional sorting options, Most proficient and Least Proficient.
c. Press the Export button to generate a report similar to the table provided. After the report is generated, press the here button in “Click here to download” to download an Excel (.xlsx) file.
Each of the table headers has arrow buttons to change the sorting.
Below the table, you may use the left and right arrow key as pagination to review additional courses assigned to a trainee.
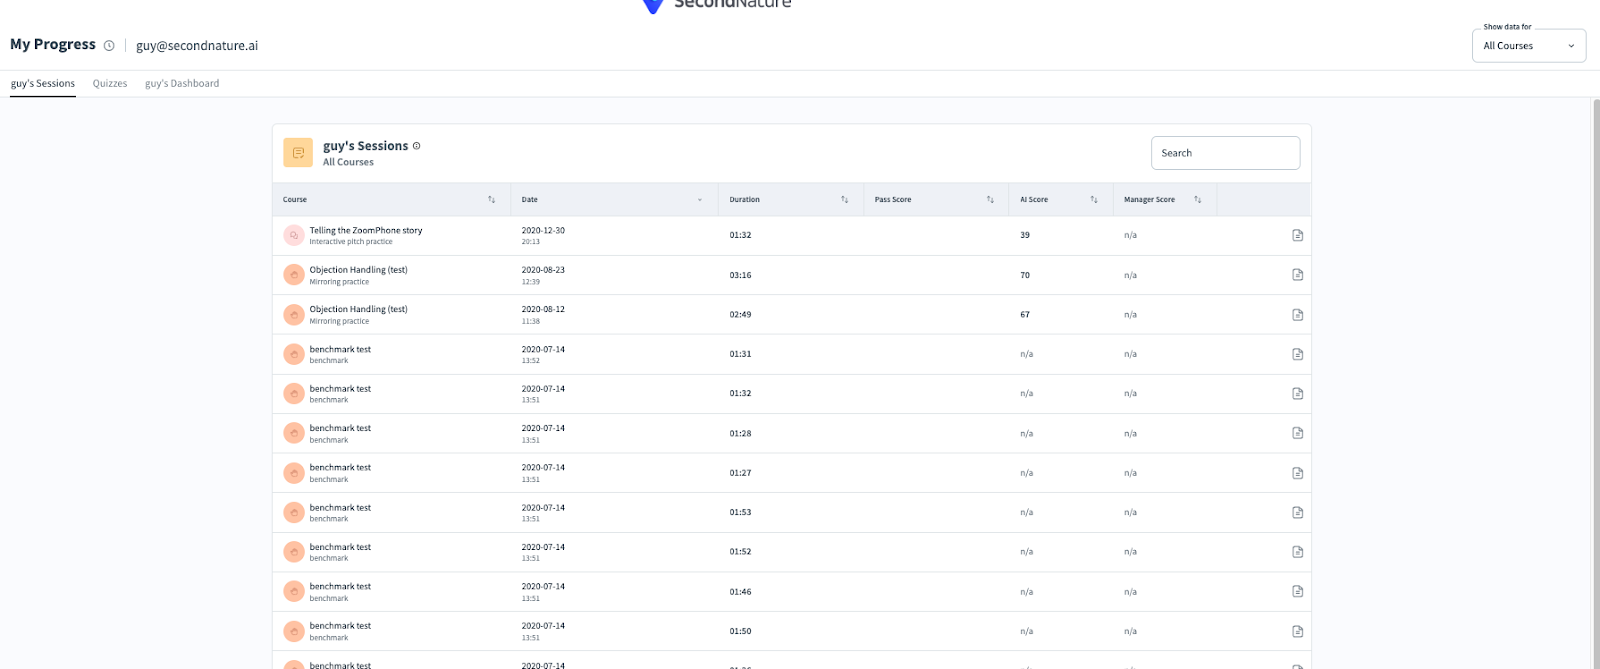
In the My dashboard tab, the manager can click on the name of a trainee in the heatmap and get redirected to their My progress page.
Example below depicts clicking on a user’s (Guy’s) My Progress page:

Heatmap Explanation
# of Tasks in Course With Pass Scores | # of Tasks Trainee Passed | Heatmap Color |
0 | N/A | |
1 | 1 | Green |
1 | 0 | Red |
2 | 2 | Green |
2 | 1 | Yellow |
2 | 0 | Red |
3 | 3 | Green |
3 | 1-2 | Yellow |
3 | 0 | Red |
More Data
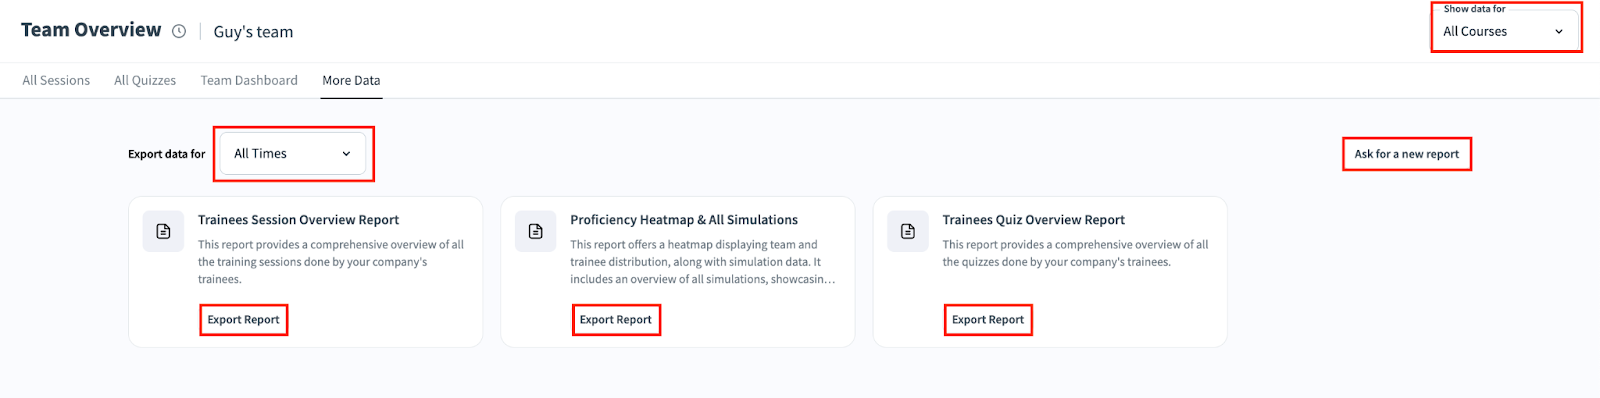
The Team Overview > More Data page provides more information on your team.
At the top of the page is a Export data for time filter which can be adjusted for Past 30 days, Past 90 days, Past 180 days, Past Year or All Times. This will affect subsequent reports which are generated. [Remember there is also a filter at the top for courses.]
Each available report has an Export Report button. When clicked, this will generate the report. A popup will inform you “Your report is being processed and will be sent to your email address in the next few minutes.”
Currently there are three reports available:
Trainees Session Overview Report: This report provides a comprehensive overview of all the training sessions done by your company's trainees.
Similar to the report provided in All Sessions.
Proficiency Heatmap & All Simulations: This report offers a heatmap displaying team and trainee distribution, along with simulation data. It includes an overview of all simulations, showcasing passed and available simulations, sessions completed by trainees, and their best scores. Additionally, the proficiency heatmap reveals the highest scores achieved by each trainee in various courses.
Similar to the report provided in Team Dashboard.
Trainees Quiz Overview Report: This report provides a comprehensive overview of all the quizzes done by your company's trainees.
Similar to the report provided in All Quizzes.
Press Ask for a new report to generate an email to support@secondnature.ai if the reports provided are not sufficient. Please include all relevant information on what the requested report should include.